Introduction
Background
After graduating college, I began working as a test engineer for a semiconductor company. My primary role was to develop test programs for microcontroller devices. This testing was conducted using automated test equipment (ATE) platforms, similar to the one shown below
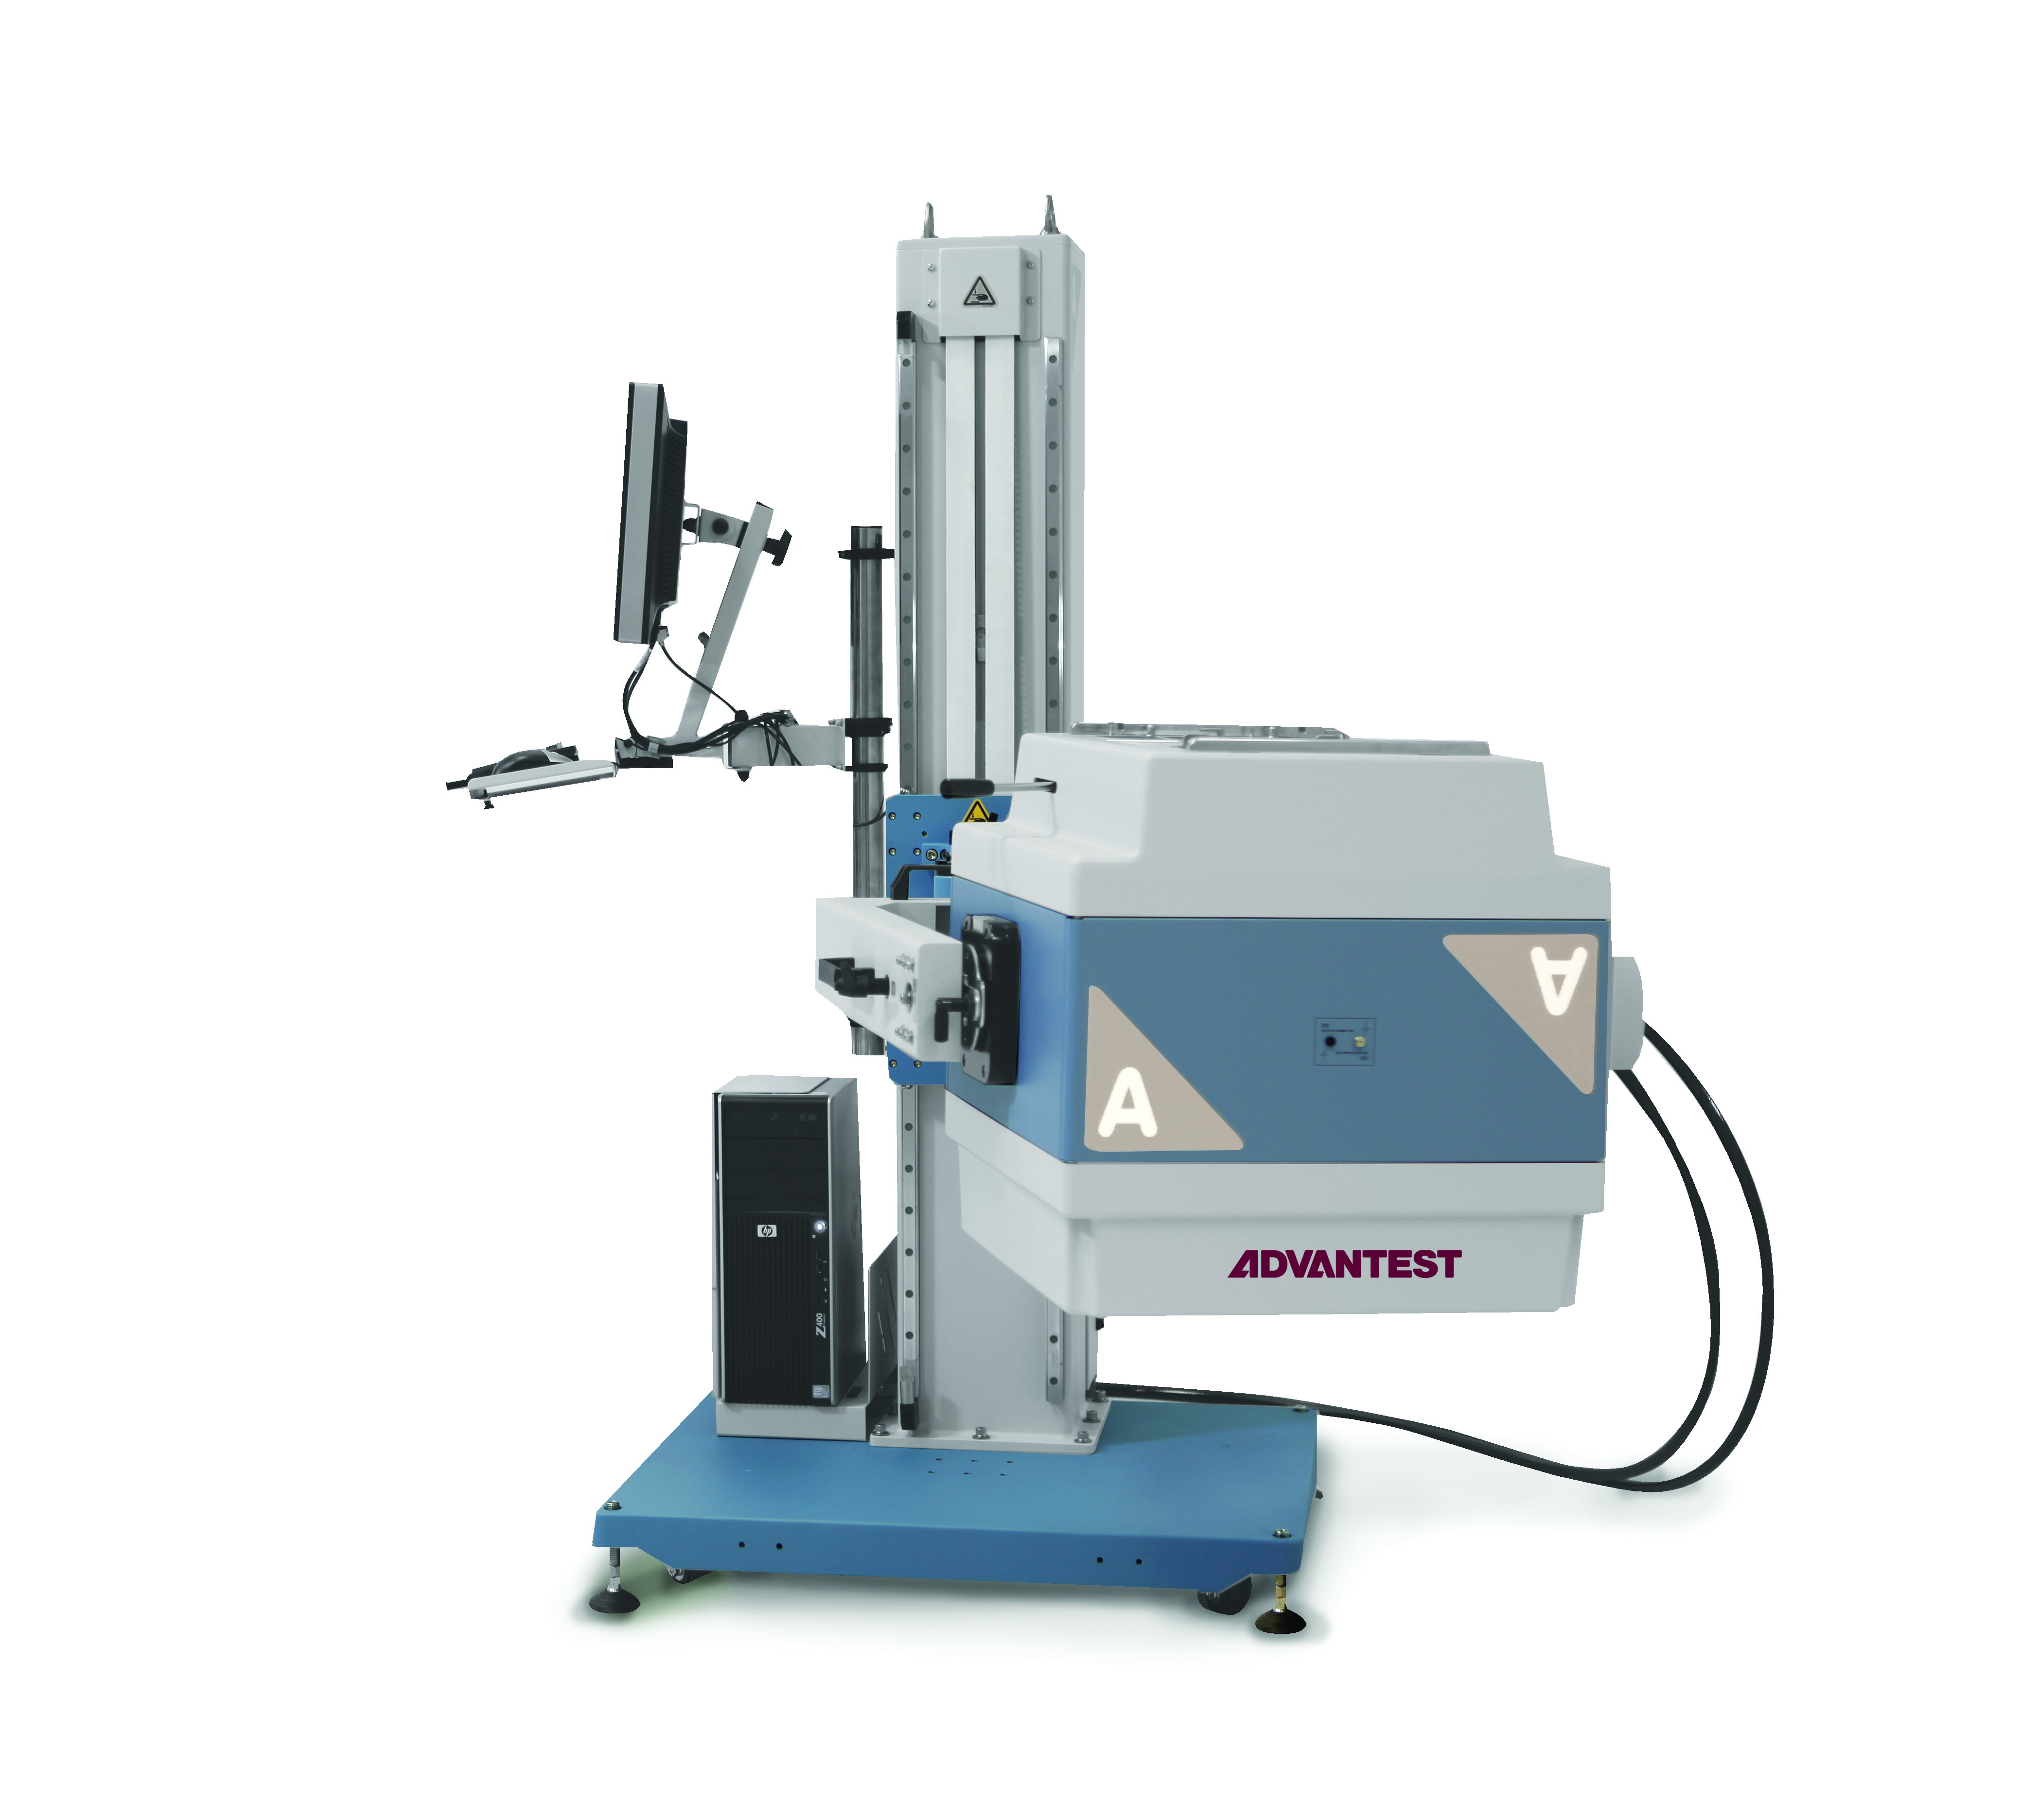
I became quite enamored with the whole testing flow, from the tester hardware to the robust software interface provided for control. By predefining voltage levels, current ranges, and test setups, it is quite seamless for me to hop on my computer and execute tests, benefiting from several key advantages:
- Automated control: Everything is wired once and controlled via relays, eliminating the need to manually toggle switches or connect/disconnect cables. This prevents accidental things like shorts/opens.
- Built-in protection: The software minimizes the risk of accidental over-voltage or under-voltage condition
- Remote access: Once the DUT is connected to my test hardware, I can simply log into my host PC and debug away
These features create a safer, more efficient debugging experience and enable remote testing capabilities. I began thinking how I could replicate this testing framework (both at the hardware and software level) in my personal project sphere, mainly involving embedded systems.
Motivations
The main motivation for developing this project was my bring up of another personal electronics project - a wearable PCB. Bring up involved many separate tasks that quickly became tedious. In my original setup, I had to open my IDE to flash the program, use a separate tool to monitor UART output, and physically power-cycle the DUT if the debugger got stuck. Worse yet, a simple mistake - like applying an incorrect voltage - could fry a chip, leaving me upset in my lack of care.
Frustrated with these pain points, I thought: why not replicate the advantages of an ATE system in a setup tailored for embedded systems? At the core, I really needed many of the same capabilities as a semiconductor test platform:
- Supplying controlled power to a device
- Measuring various voltages and currents
- Communicating over a serial bus
- Logging data into a file
I scoured the internet for DIY or commercial solutions that could handle both testing and flashing for embedded devices. However, I found very few options that met my specific needs. There were solutions for some of the specific tasks I wanted to do (maybe sample from EE equipment, or log UART data) but I wanted an integrated solution that could do all of these things together. And so—story of my life—I decided to build my own solution.
Requirements
Scope of work
Like any good electronics project, there are two sides to this, the hardware and the software.
I will talk about each component in detail in the next sections.
Hardware side
On the hardware side, what I really needed is basically an "interface board". No complicated components, pretty much just need a way to connect the signals and power rails on the DUT to an easy to access test board. From my semiconductor testing days, that was the main purpose of our hardware - providing an interface between the tester and the DUT.
When you break it down, I want these things to connect to the DUT
- power delivery
- signals
- could be simple GPIO or serial protocol signals
- Debugger signals (JTAG, SWD, etc.)
- USB port
This interface needs to be repeatable and reliable, meaning I can quickly swap it between boards.
Another important thing for me was being able to control USB power. My DUT had a micro-USB slot for USB power, but often I would like to power-cycle this. To prevent the pain point of having to disconnect/connect this connector, I wanted the option to remote toggle this USB power.
Another small thing is the conversion of UART to FTDI signals. The project I originally designed this for had one on chip, but in future versions I want to save board space so I want my testing solution to accommodate the version on the tester instead of the DUT.
So to summarize what we need out of the hardware
- custom PCB solution allowing access to relevant DUT power and signal
- software controllable USB ports
- UART to USB conversion
Software side
On the software side, I wanted to replicate the comfort that debugging with semiconductor test equipment provided me. This meant that after some initial setup I could debug away and not have to constantly worry about power. Collecting data would be standardized and easy to initiate. Controlling electrical equipment could be done on the software side instead of pushing buttons on my multimeter or power supply. For more complicated tests, I could synchronize test equipment control and data collection. All of this would be wrapped up in an easy to use user interface as well.
With all of these broad features in mind, we can see the software needs to handle several key functions
- controlling power delivery and measurement
- basic debugger toolset (target checks, flashing programs, reset device, etc.)
- user friendly interface for executing tests
- synchronizing actions, examples include
- turning on DUT power when we want to flash
- collecting measurement and serial data that can be timestamped together
I chose Python as my language of choice. for software development. Python has lots of good test equipment controls like pyvisa. There are many native plot tools like matplotlib. You can code basic UIs with Python through tkinter. Probably most importantly - I also have much more experience with it compared to other languages!
Resources
This project is pretty resource intensive. There is a decent amount of hardware that I purchased, along with all the test equipment.
- Power supply
- (programmable is a requirement)
- I used the SPD3303X from Siglent
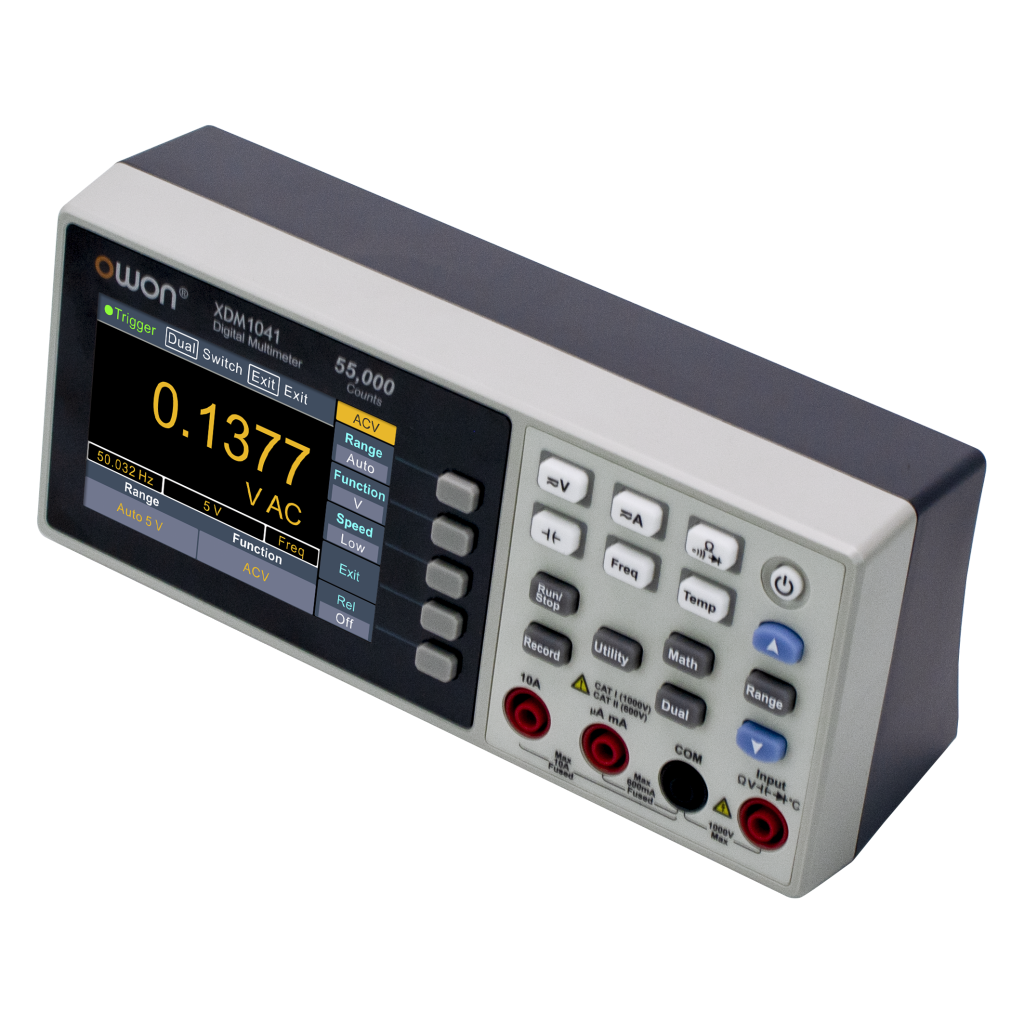
- Digital multimeter
- (again, programmable is a requirement here!)
- I used the OWON XDM1041, a fairly common hobbyist multimeter
- Debug probes
- in order for full integration with my software, will need vendor to provide some executable API for flashing, toggling, etc.
- USB relay module
- Combined this with a USB hub to hack together a software controllable USB relay hub.
- Host PC
- I have the whole software package running on a decent Linux Ubuntu machine.
- In theory I was thinking about what running this on a Raspberry Pi would entail, but really if you want any change of managing a GUI front-end and want cool features like webcam support to just work and not bog down your system, I recommend a full-fledged PC.
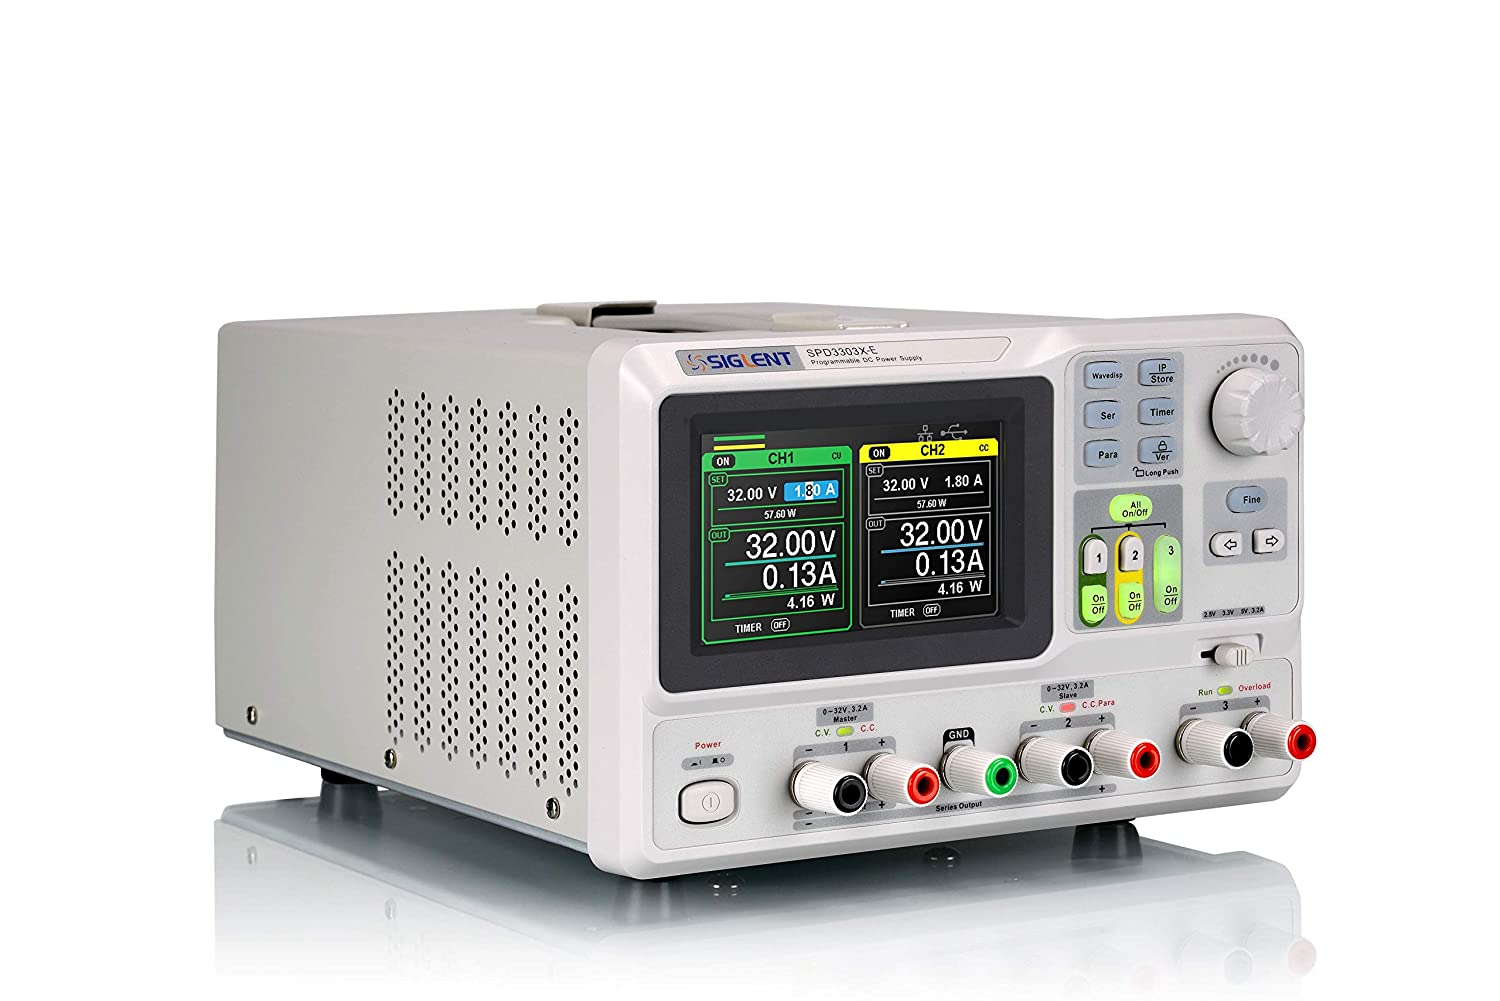
SPD3303X-E Programmable DC Power supply from Siglent
You obviously don't have to use my specific models of lab equipment, you can use whatever you have in your lab. You will just have to adjust the code for what SCPI commands correspond to what. Luckily through abstraction the main application will still work normally once this is setup!
Capabilities and Implementation
This section will focus on the main core features of the application, with some basic introduction to how each one works technically. This section will contain the most technical content, and the Design section will mostly cover the integration of these various components into a final, complete system.
Relay USB control
I wanted a way to toggle the state of an individual USB port through software. Why would I want this? Well, in the early stage of my project I was powering only through USB power instead of a power supply. Sometimes over USB power the target would become bricked so the debugger couldn't talk to it and require a power cycle. This would require plugging and unplugging the micro-USB (later I did switch to a USB hub with a button, but it was still annoying). I wanted to be able to not even take my eyes off my computer, click a button, and power-cycle my DUT.
It seems like such a simple thing, but it really is distracting in a heated debug session to have to perform this task. It also avoids uncessesary mating/unmating cycles that risk connectors getting ripped off if your solder job is sub-par. By adding automated control of USB ports, we can also cycle between power sources easily. This allows us to do automated testing on things like battery charging, disconnecting the USB power when we reach full capacity to start discharge.
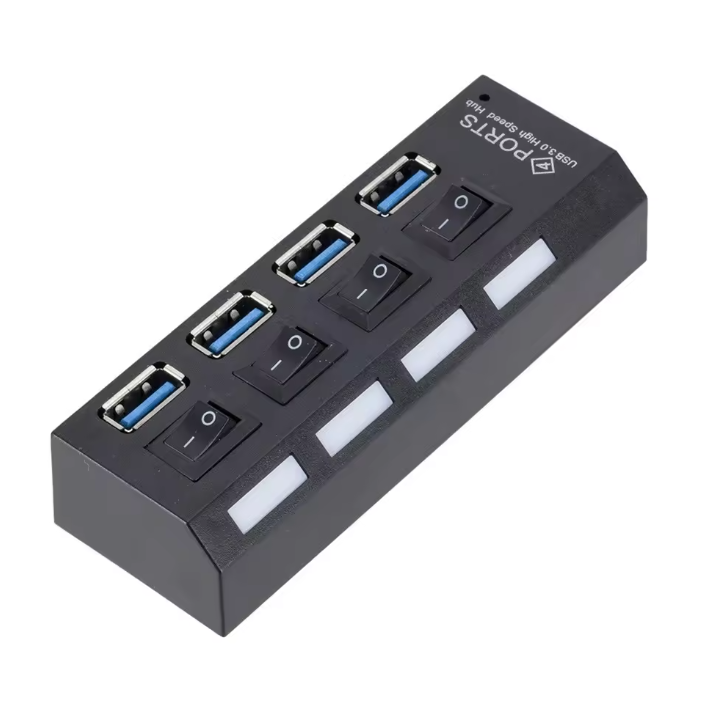
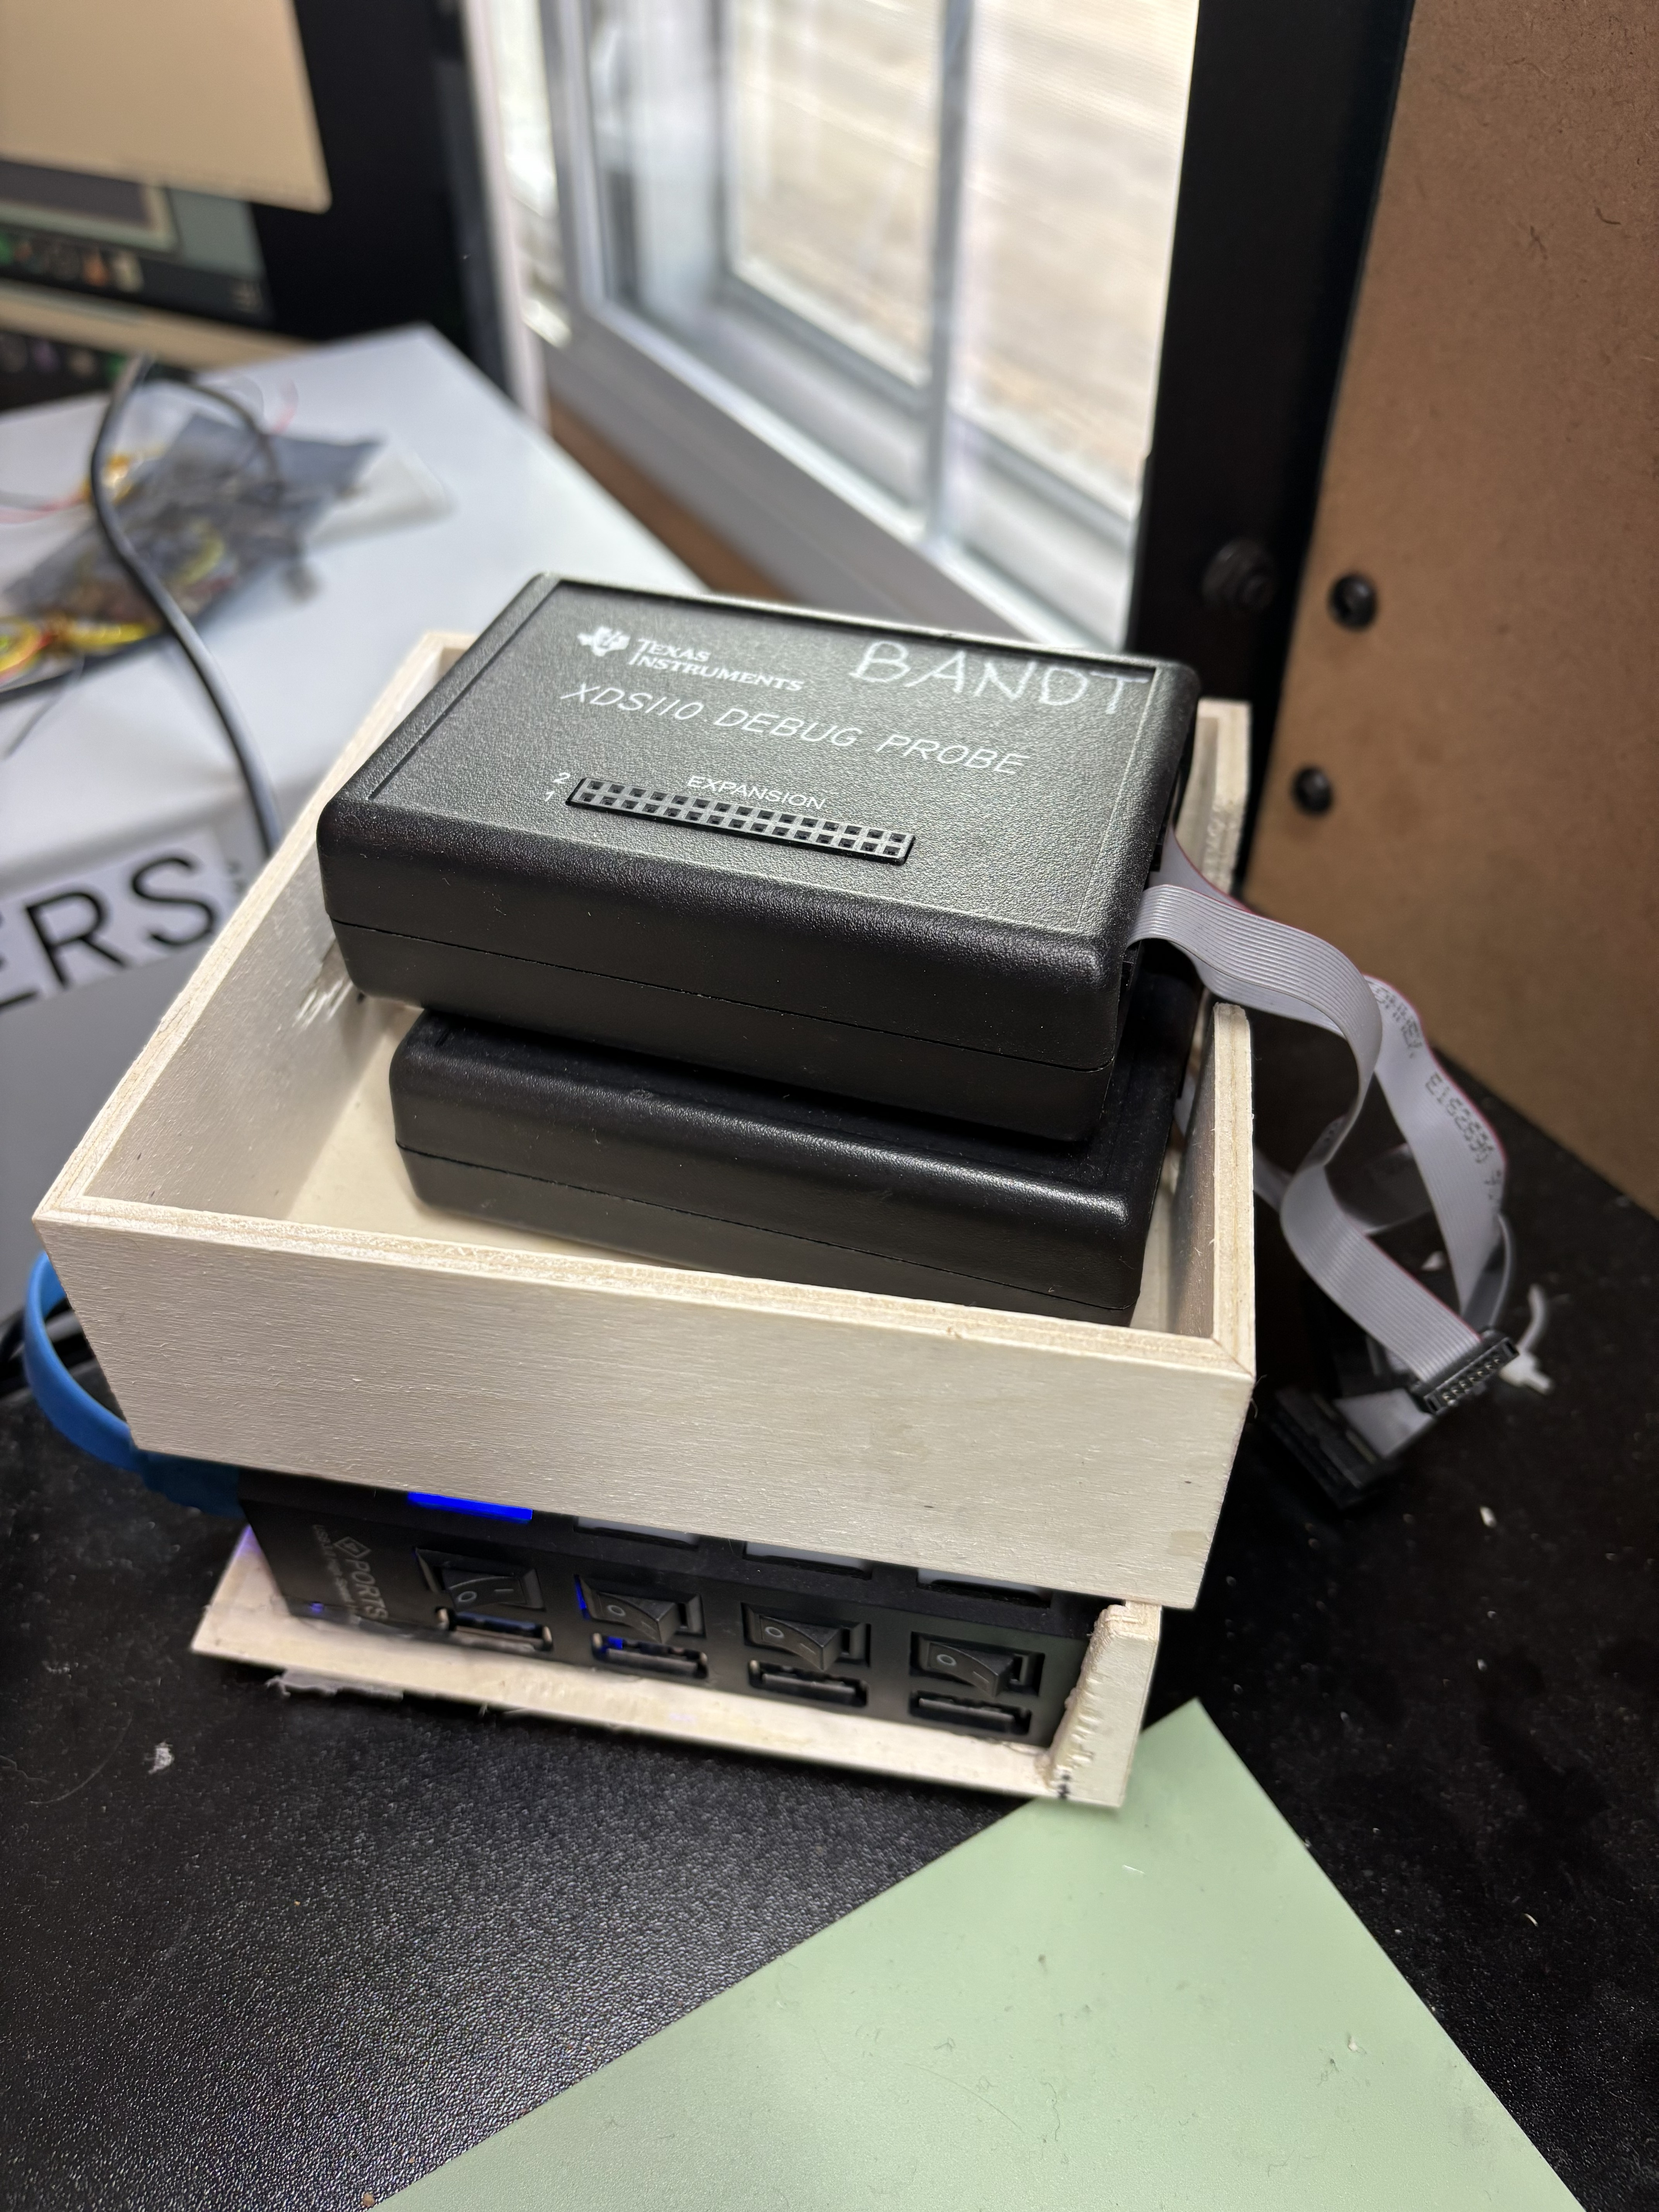
For that I had to purchase a USB controllable relay and a standard USB hub. For the USB hub I found a nice one on Aliexpress that had good indicator lights and most importantly some manual switches.
The next component was a USB relay module. This one below seems to be the standard online.
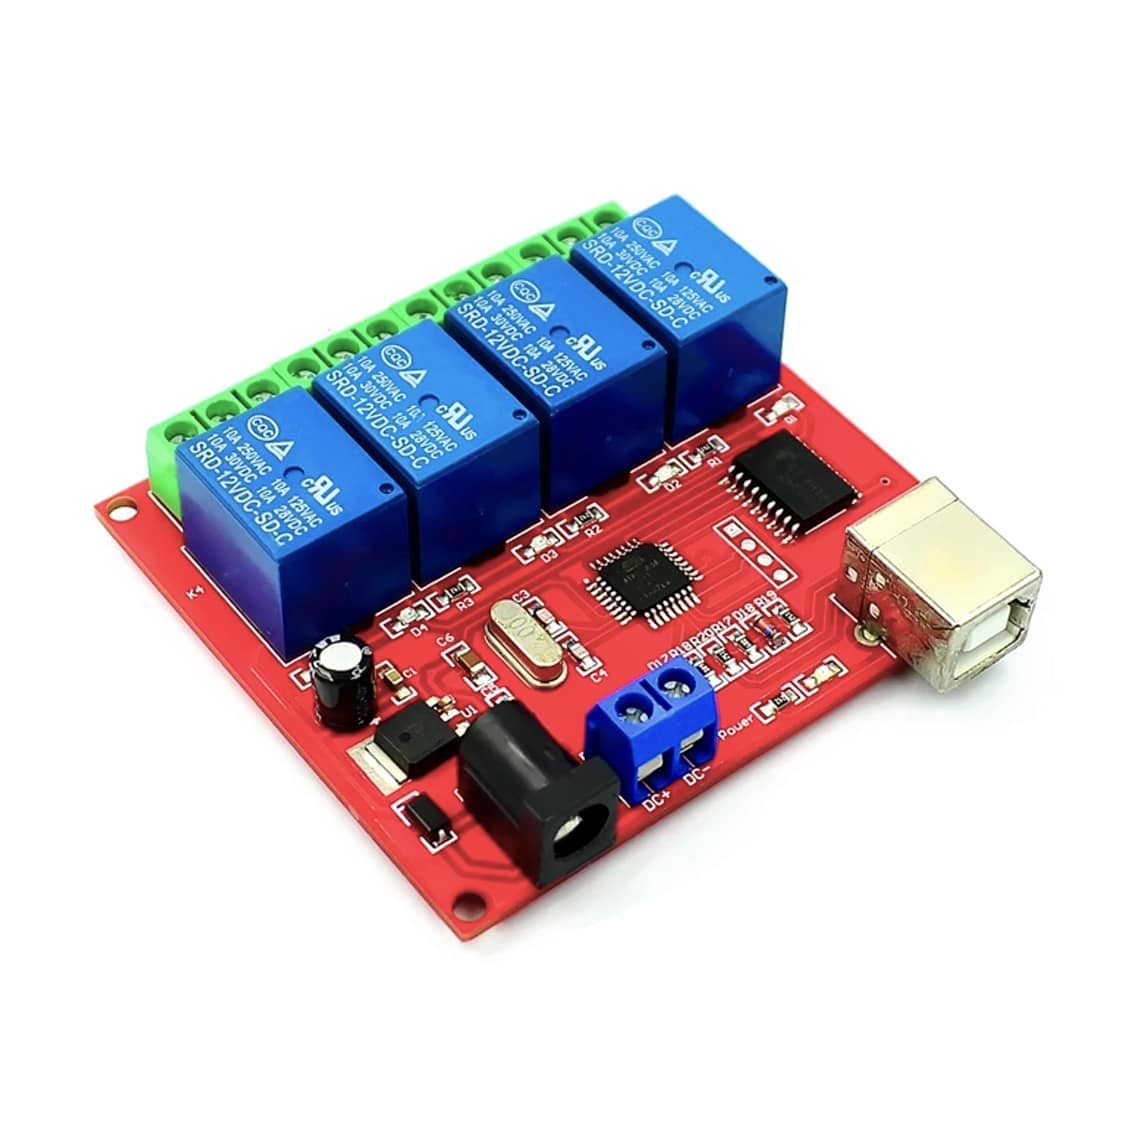
USB relay module in all its glory
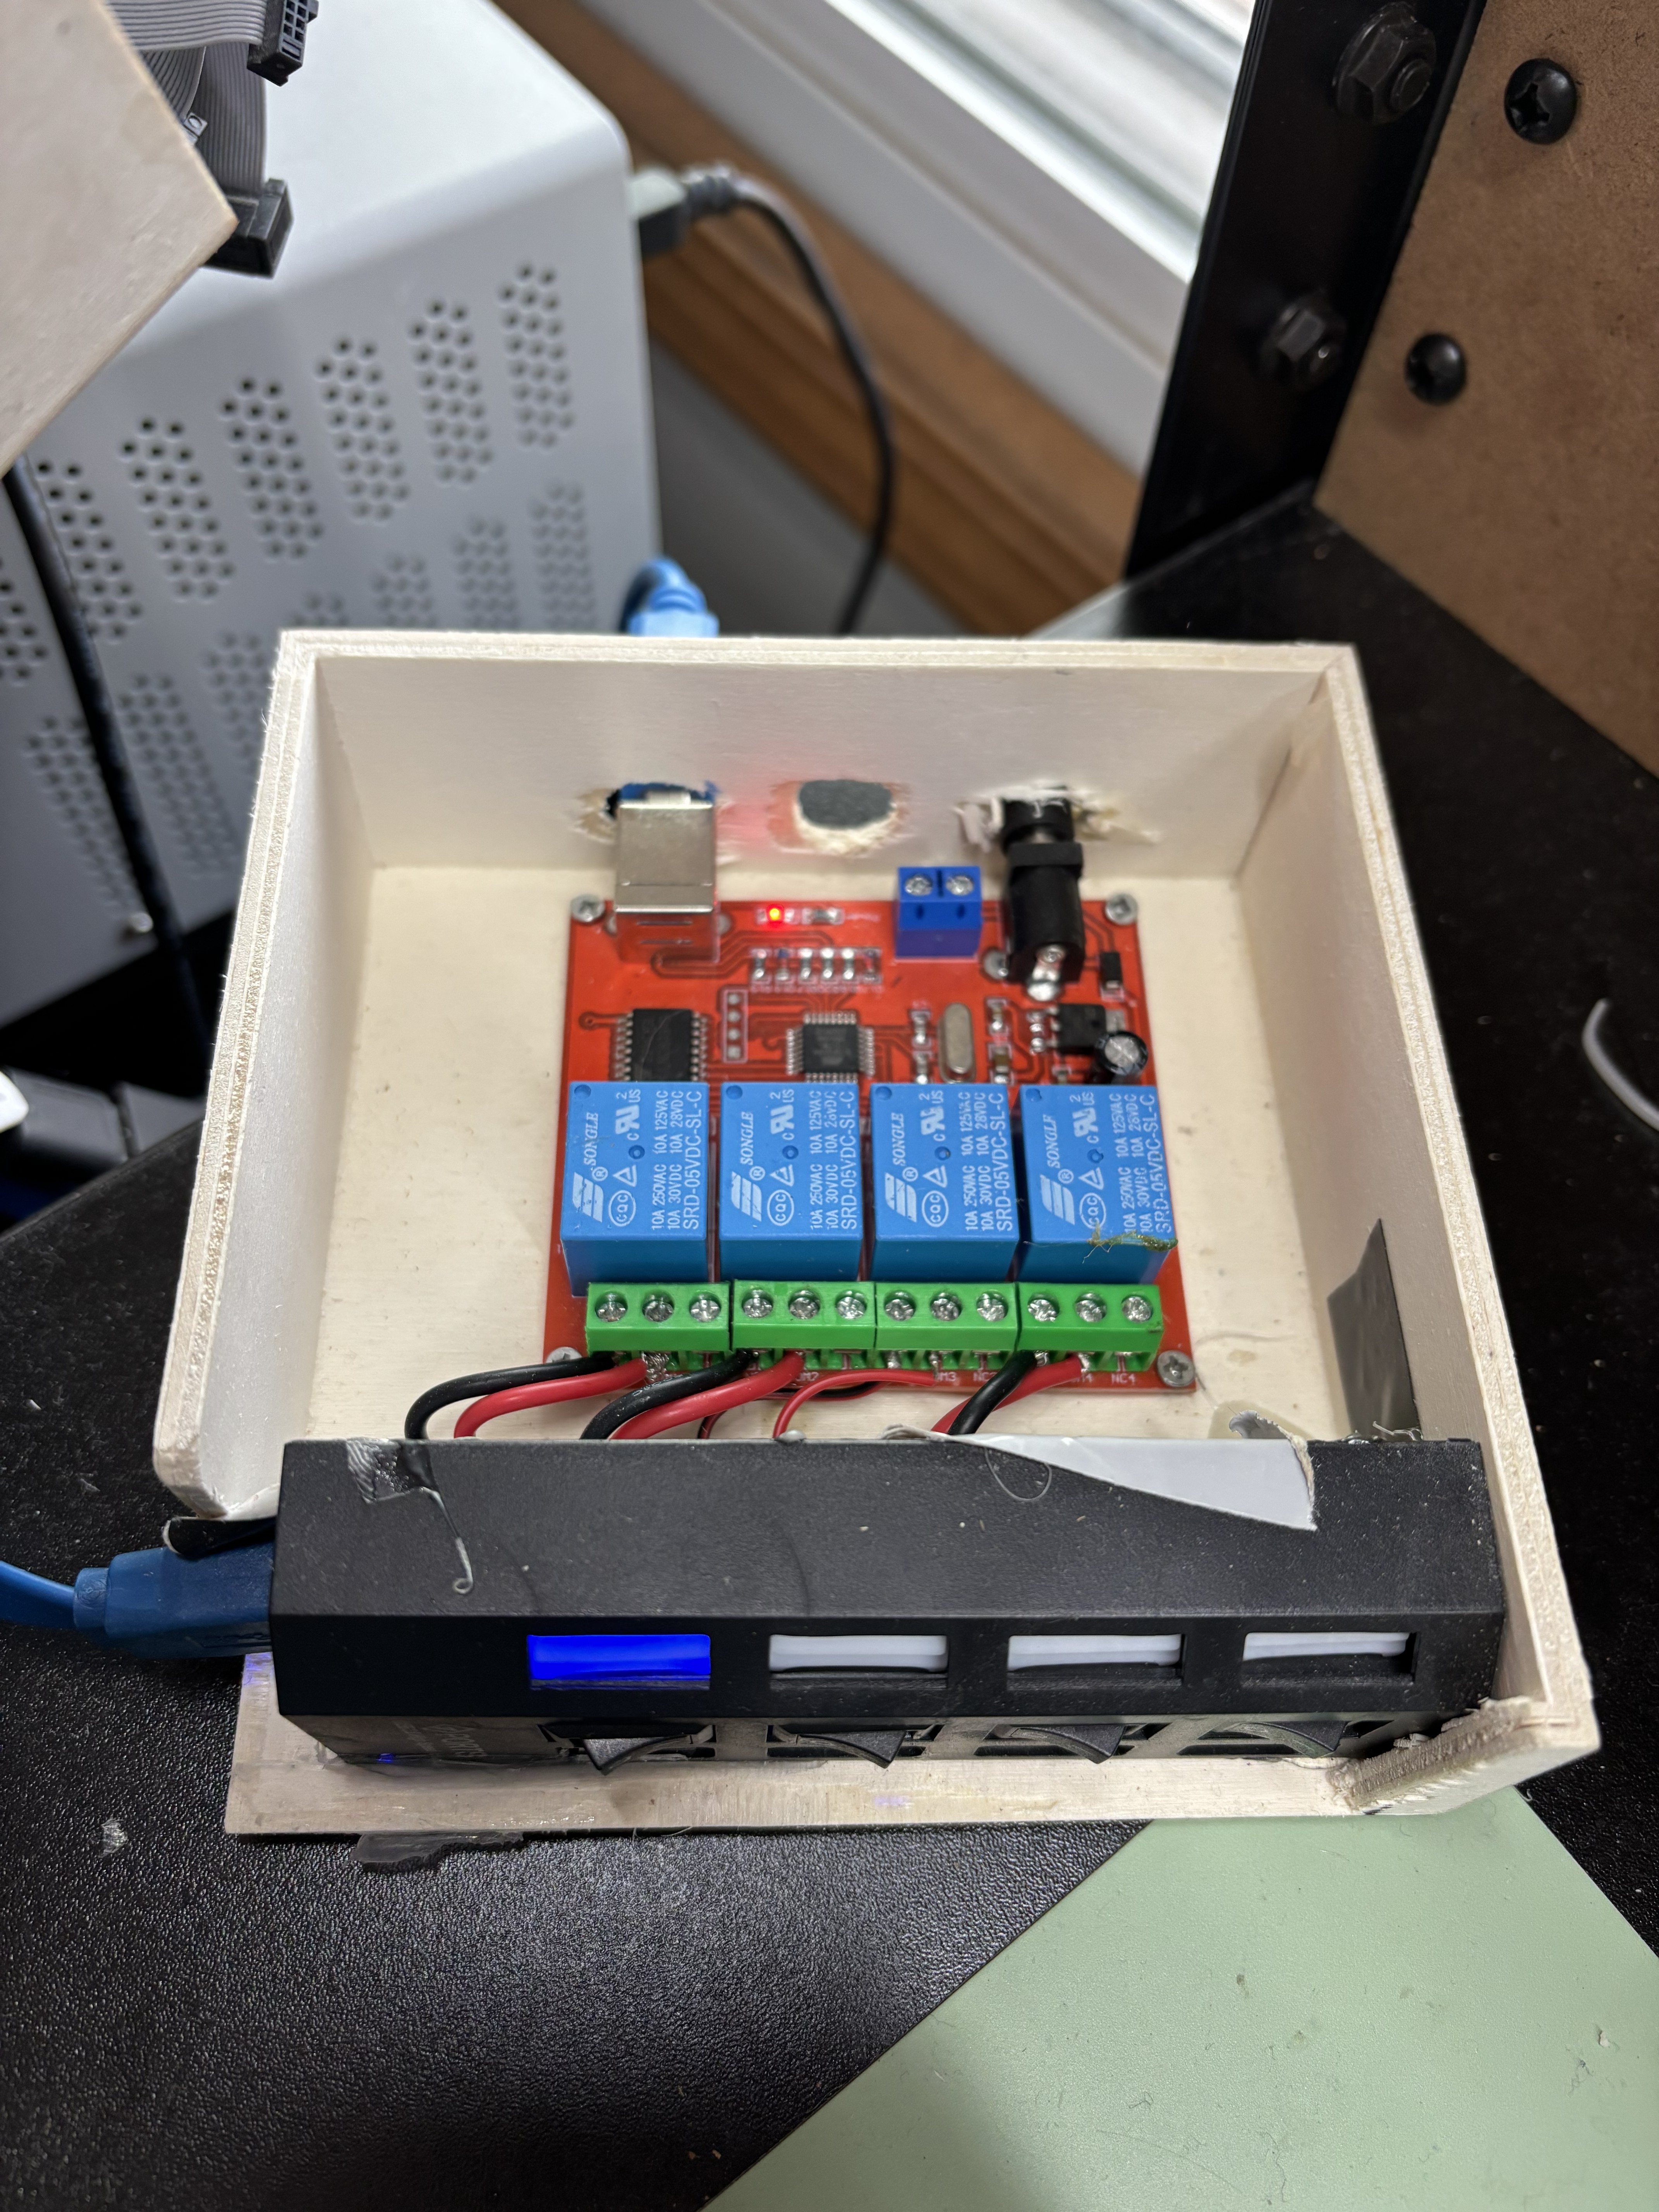
Putting them together yields something like this
USB serial logging
Another feature I wanted was showing output of any serial port, and being able to log that data into a text or Excel file. Most people are familiar with serial monitor applications - when I was developing on Windows, I used TeraTerm and when I moved to Linux I switched to PuTTY. But I wanted more control over how this was conducted, including
- logging serial data to a standard location with standard file naming
- timestamp inclusion / formatting (was very surprised to see that PuTTY does not have this as a feature!)
- auto-connect and reconnect if serial connection is dropped
- live data plotting
Python’s pyserial package, through the serial module, provides a flexible way to interface with serial devices. It allows for reading, writing, and managing serial ports programmatically. Using pyserial, I could automate serial logging while also incorporating my desired features.
Here is a very basic example connecting to a port on a Linux machine (because port path is at /dev/tty instead of the COM you would see on a Windows machine)
import serial
import time

# Open serial port
ser = serial.Serial('/dev/ttyUSB0', baudrate=115200, timeout=1)

# Ensure connection is established
if ser.is_open:
    print(f"Connected to {ser.name}")

# Continuously read from the serial port and log with timestamps
try:
    while True:
        data = ser.readline().decode('utf-8').strip()
        if data:
            timestamp = time.strftime("[%Y-%m-%d %H:%M:%S]")
            print(f"{timestamp} {data}")
except KeyboardInterrupt:
    print("\nClosing serial connection.")
    ser.close()
This is a very basic example. Full integration with the main application took some design effort, which I will get into in later sections.
Debug probe toolsets - reset, compilation, flashing
Another one of the main repetive tasks during debug is program flashing to your target. I needed a way to easily have access to typical debug features in my software application. This would also allow me to move from a chip vendors IDE and do my programming in Emacs, my preferred text editor.
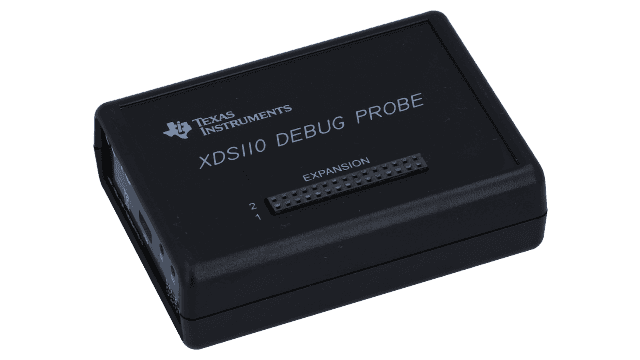
The debug probe I'm using is the XDS110 from Texas Instruments. Luckily, the debug probe I'm using includes some API where you can run scripts and flash the program.
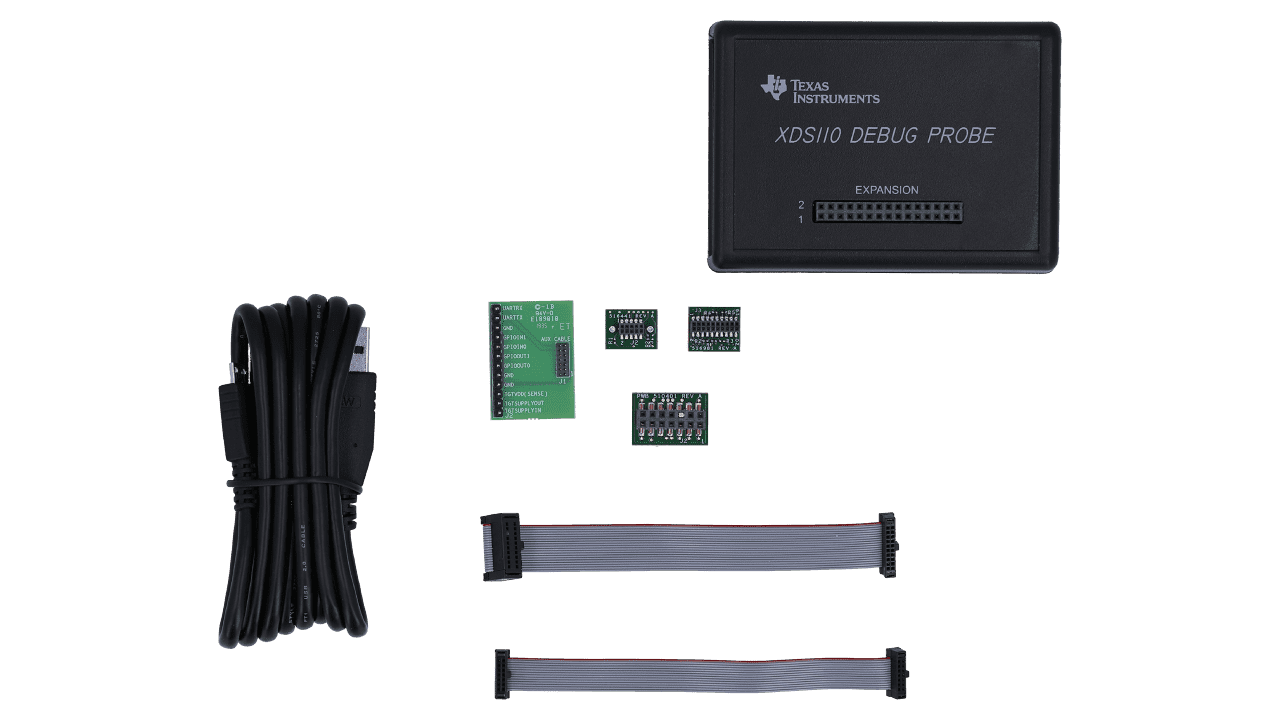
Everything included with the XDS110 from Texas Instruments
When you install their IDE, Code Composer Studio, and add the XDS110 as a debug probe a ton of different executables are installed on your system. These can be executed with flags for certain options
Capabilities include
- checking for connected debug probes
- asserting targets reset signal to high, low, or issuing a toggle
- compiling program
- flashing compiled program to target
- multiple power options as well
- picking debug probe to use based on serial number
There is also some other capabilities including being able to assert nRESET low or high.
In my test setup I have two of these connected. This may not be needed for most test setups, but I find it useful when I have two prototypes with just slightly different hardware configurations.
You can set and then call a specific serial number to issue commands to.
Being able to separate myself from an IDE allowed me to do most of my coding in Emacs, a text editor I started using in late 2022.
I have not yet figured out how to actually perform debug abilities without usage of the IDE (breakpoints, reading from register memories, etc.) Maybe in a future update ....
Test equipment control
The last main capability would be control standard electrical test equipment. This is enabled primarily through SCPI commands. SCPI was defined as an additional layer on top of the IEEE 488.2-1987 specification "Standard Codes, Formats, Protocols, and Common Commands". The standard specifies a common syntax, command structure, and data formats to be used with all instruments.
Similar commands are grouped into a hierarchy or "tree" structure. The usage of the colon : can specify sub commands. For example, let's say we have a DMM and want to measure certain parameters. The command structure might look like
  :MEASure
       :VOLTage
            :DC?
            :AC?
       :CURRent
            :DC?
            :AC?
              ...
In this project, the actual protocol in which SCPI commands are issued varies. Some pieces of equipment may use USB / serial, some may use the industry-standard VISA.
Use-cases
Example 1: DUT power With power supplies I can power my DUT's voltage rails to a known voltage every time. Let's say I'm powering some 24V device, forget that's what the voltage is set at, and come back to turn on my device that needs a 3.3V signal. Well, everything on that voltage rail is probably smoke after turning on that power supply! (this actually has happened to me)
With a software controlled solution, I can save the device voltage off in a configuration file and
Example 2: recording power draw When I'm using my power supply, I actually know exactly how much current my device is drawing. I can record this and basically make a nice "power profiler"
add.a graph of live plot current measurements
Example 3: making DMM measurements Ok, the first example was supplying power but what about recording voltages or currents? We can leverage the same framework for making these measurements.
Because I'm using a power supply to power my device's voltage, I also know how much current it's drawing.
HIL controller
Hardware-in-the-loop (HIL) testing involves validating systems by connecting systems to simulated models of a stimulus system. I know them mostly in the context of automotive parts. Car manufacturers use them to actually simulate sensors and actuators, say for testing an electronic control unit (ECU). Or some processor may be running that is emulating the engine dynamics. My usage of a "HIL" controlled was wayyy simpler .... simply controlling buttons. I wanted a way to be able to remotely "push" those buttons to expand my debug capabilities away from my lab.
Essentially, all I'm doing is connecting the GPIO inputs to my button input leg (direct connect to the MCU). The pins are tri-stated on the Arduino with a few lines of code (just setting them to an input)
// set back to tri-state
pinMode(gpio_pin, INPUT);
when I want to press them, I write them to go to ground (0V) and as my buttons are active-high
// set up as OUTPUT
pinMode(gpio_pin, OUTPUT);

// "click"
digitalWrite(gpio_pin, BUTTON_ON_STATE);
delay(BUTTON_DUR_MS);
digitalWrite(gpio_pin, BUTTON_OFF_STATE);
I even took some oscilloscope shots of what my "average" human press looked like, and arrived at roughly 120ms. This is reflected in my code
#define BUTTON_DUR_MS 120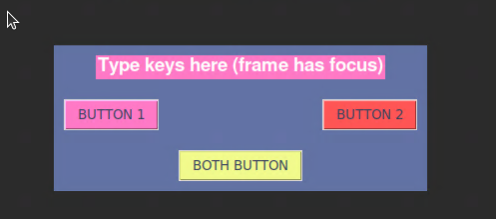
Combining this with a webcam feed of my electronic display and I can remotely debug at ease!
This is likely as far as my HIL controller will go (if you can call it that). In future projects I may need to add simulated sensor inputs, but that's likely the extend of the scope of my personal projects at this point.
Design
Sketches, Diagrams, or Mockups
To start the design process I made a block diagram to see what all the inputs and outputs I would want in my system are.
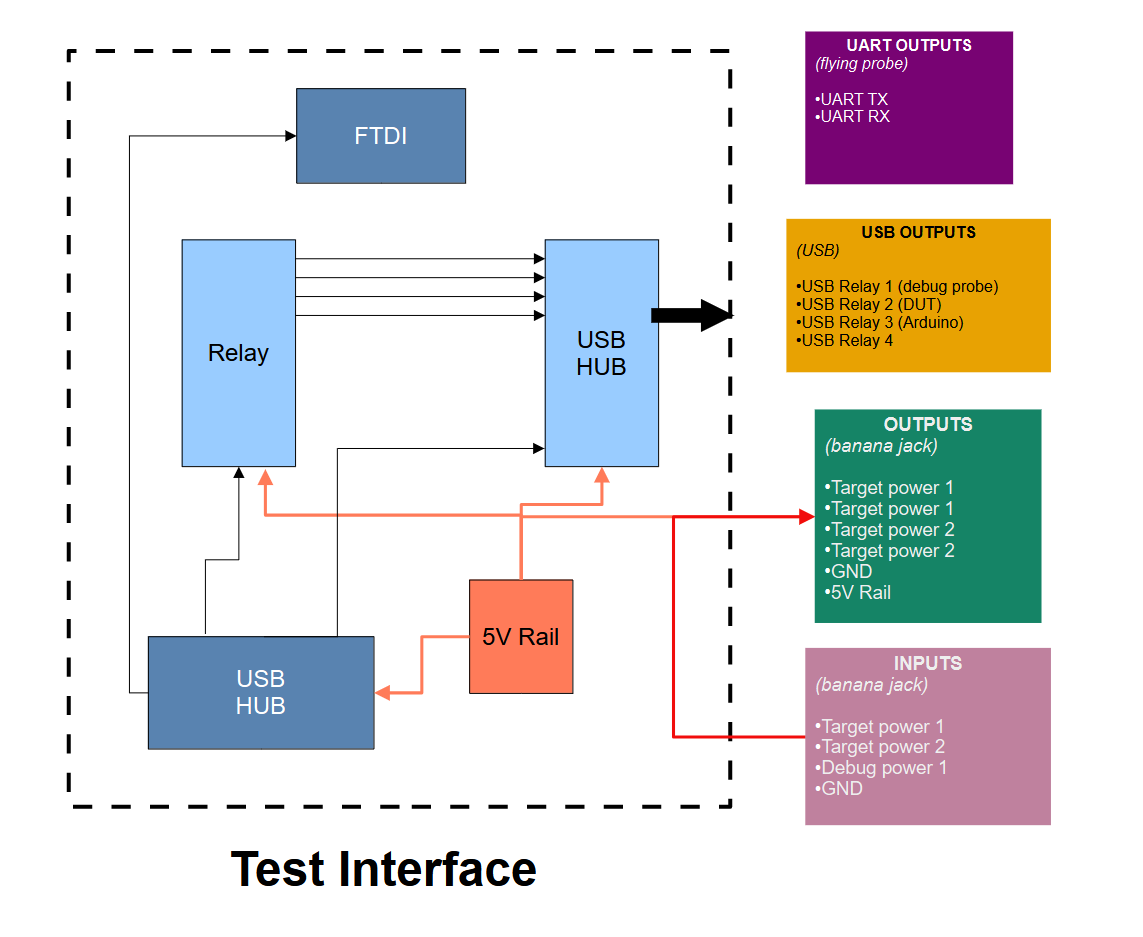
You can see the main inputs and outputs in the right hand side of the block diagram. Mainly USB outputs that are controlled through the relay and power outputs through banana jacks.
The yellow block includes some examples of USB devices I want to power. I actually found some issues in testing when the debug probe was hooked up, so this was directly connected to my host PC now.
Design Approach
hardware interface
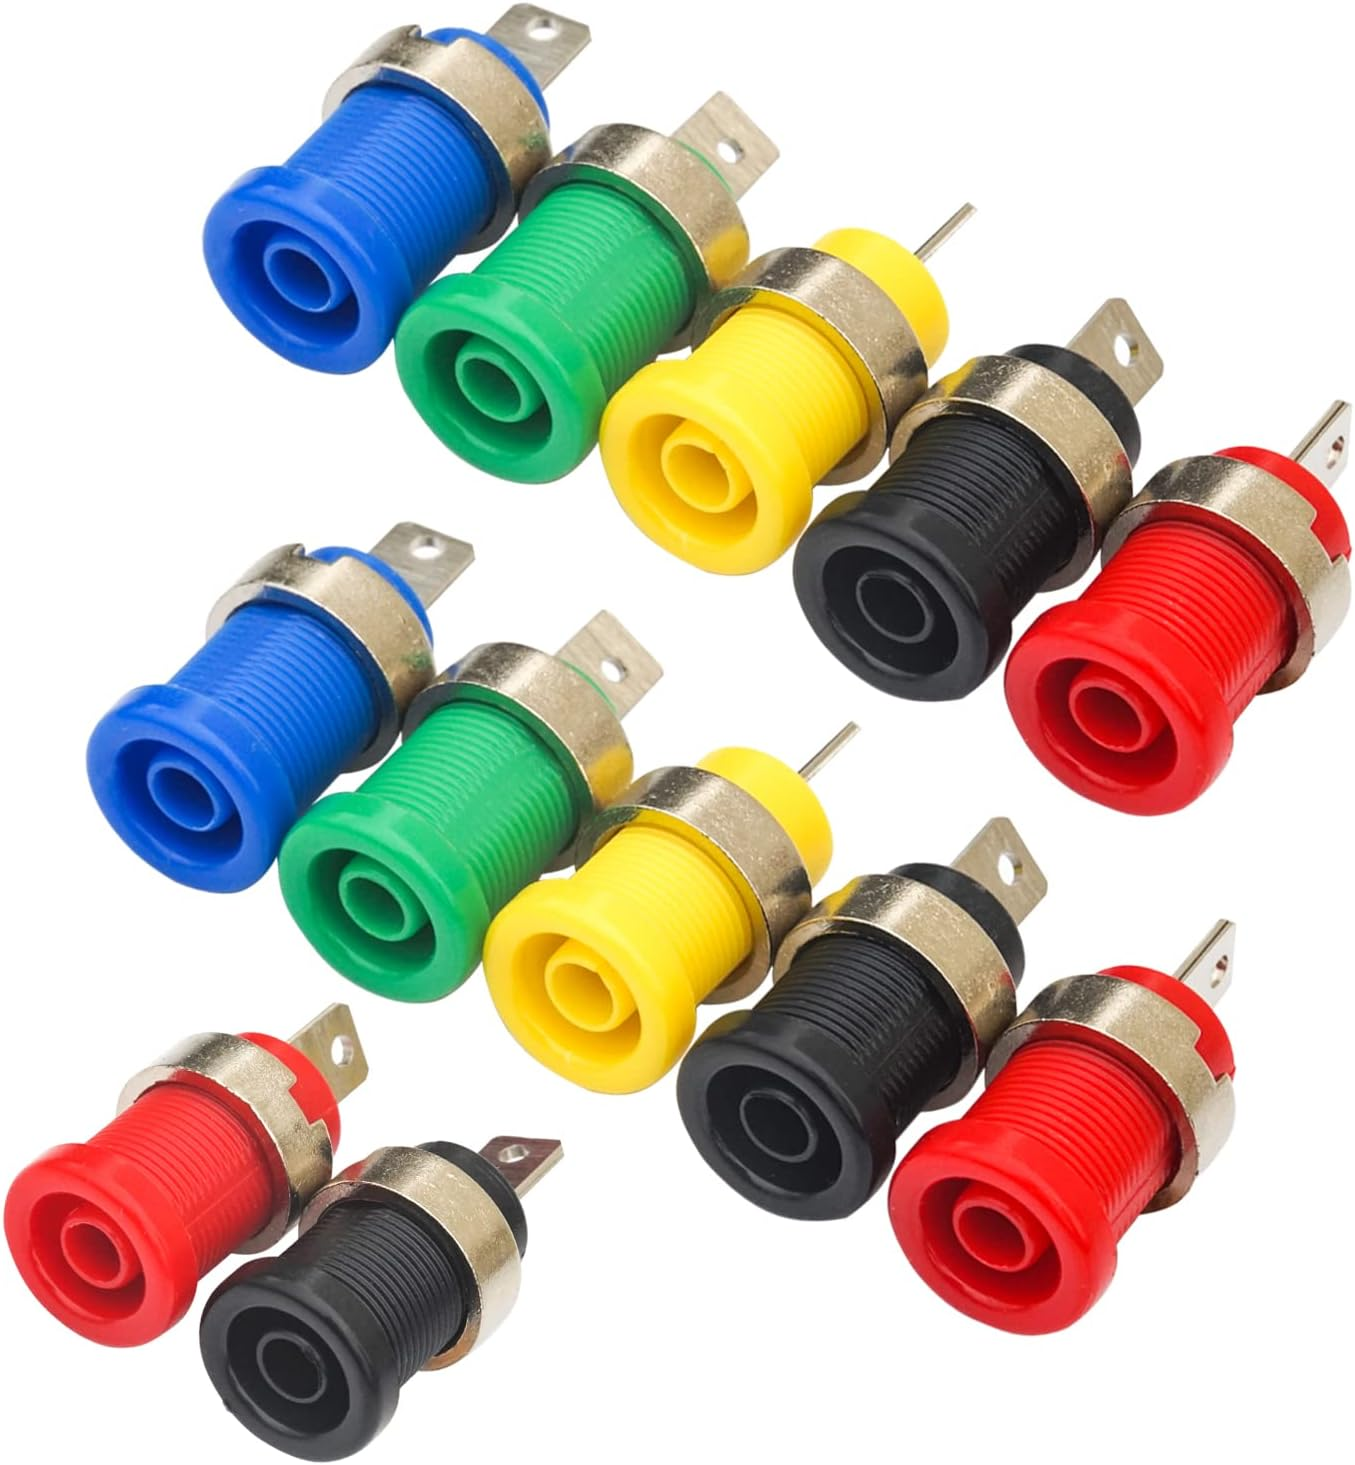
For connecting to test equipment, banana jacks are the most common. Since my goal was to replicate some of the convenience of ATE systems, I also considered integrating relays or digital switches to automate power control and signal routing.
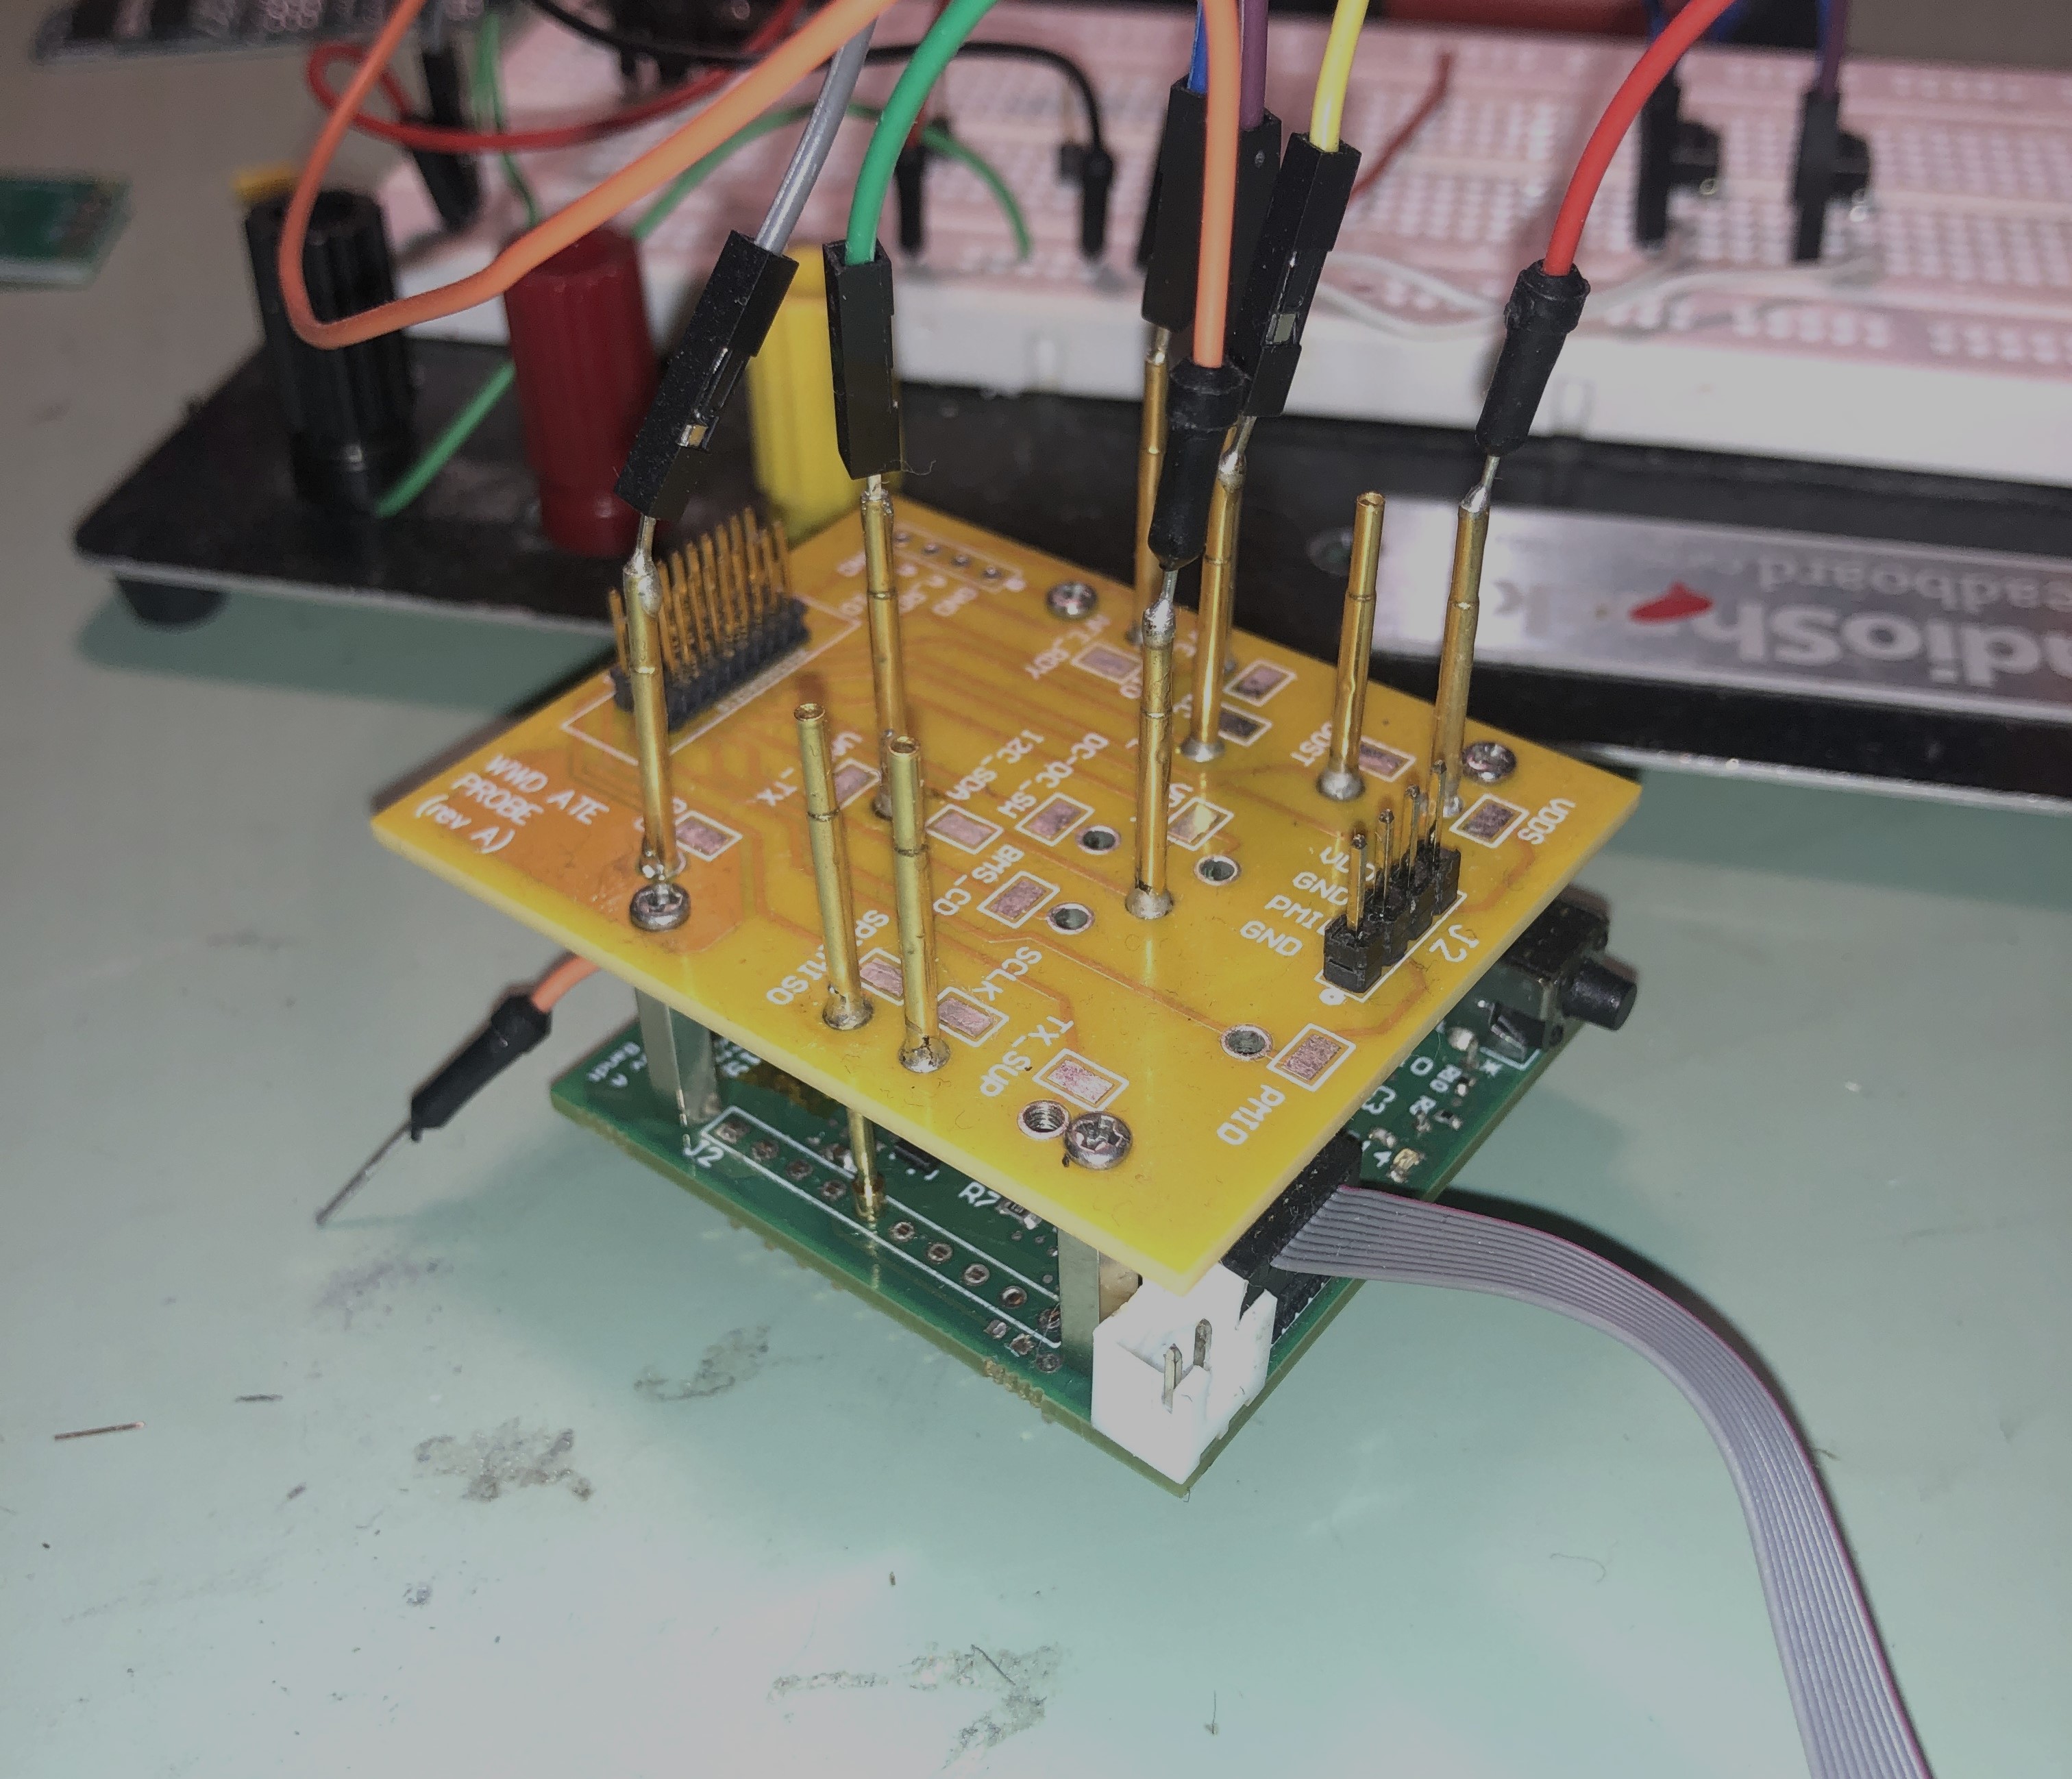
The challenging part in the interface part was mainly getting the DUT signals, especially for a board of my size. I also wanted a very repeatable test jig, meaning I can quickly unhook it and hook it to say a different board or what not.
After some research I decided to move to a bed of nails solution. This was after some time, however, and early versions did not have this board designed. The design of this was a project in itself, so I wrote that article if you want to read more about that specific aspect of the test setup.
software solution
I would like to discuss the design approach of the software solution. From the software engineering crowd, my choices here might upset some people. But I stand by my choices, for reasons I'll explain.
I will be using tkinter as the front-end, which is a standard Python interface to the Tcl/Tk GUI toolkit. This is available on Unix systems and Windows. The usage of this front-end gets a lot of hate from software engineers I know. Many people think it's dated and ugly looking. Some would prefer to use a more modern interface like PyQt. I however, love how simple it is to use.
add some example photos of what Tkinter looks like
I think it's quite easy to sink a lot of development time into a beautiful looking user interface. Yes, there are quite good frameworks that make it easy. But I don't need many GUI features in this project. Simple buttons and labels and colors and text fields is all I really need. The most complex item is probably a drop-down menu with certain options.
add another few photos of the actual applications
Implementation / Building
Process
The build process has been incredibly non-linear. I had a vision on some aspects of this project, but because I developed this in parallel with the device that I was actually trying to test I had bursts of feature additions and then long periods of solely working on device debug. Which is good, I was actually using what I built!
USB relay
I first focused on getting my USB relay working as that was one of the main reasons I started the project. I combined these two items in a nice wooden box, and after inadvertenly blowing a motherboard up on my host test PC computer trying to supply USB power I had it working.
add actual photo of this thing in use
embedded debug probe flashing
The next thing I wanted to do was interface with my specific debug probe. I'm using the XDS110 from Texas Instruments. It is a pretty standard debug probe, nothing crazy. Retails for about 150 dollars.
I already explained in Debug probe toolsets - reset, compilation, flashing how some executables are installed
For doing this I mainly rely on the Python submodule subprocess. This module is great for executing files on your system, and more importantly, getting the output back in great STDOUT and STDERR pipes.
TI provides these features in the form of executables
- reading debugger serial ID
- toggling target
- checking target connection integrity
- building code (not related to debugger)
- flashing target
With this feature in place, I could avoid the vendor IDE entirely and do all my code programming in Emacs. I could then handle
One gap in this is I haven't figured out how to add proper debugger features like breakpoints and what not. I think this would be pretty intensive to add, and probably not worth it. So when I want to debug and view registers and memory I do load up CCS. Let me know if anyone has thoughts on debugger integration ... specifically breakpoints would be nice!
electrical test equipment control
The last feature I'll talk about the technical workings of electrical (or any other type of) test equipment control.
I mentioned earlier that the actual communication protocol is SCPI, but what I didn't mention is that there are many different hardware interfaces you can use. These include
- serial (regular communication over a COM port)
- PyVISA
- GPIB
- VX11
The actual physical connection (type of cable) will likely be one of these things
- USB
- possibly through a USB to GPIB adapter for older equpiment, otherwise directly into your test equipment
- GPIB
- Ethernet
I'm using Python to control all this test equipment, as it's my preferred language of choice. Some people complain about it being too slow for certain types of test equipment, compared to something like C or Java (I've gotten this feedback when sharing this project on forums). Well, obviously C is going to be faster but my god who wants to program a GUI application in C as a side-project? Java would be tempting and likely better performance, but I'm just so used to Python at this point it would be a big drain just for a side-project thing. This project is supposed to help me in my main projects not be a whole lot of work.
Anyway, I have a Github repo started for all my EE equipment control, you can find that link here. This is a submodule to my main module. I've been trying to get this side project (the EEequipment repo) (funny that it's really a side-project of a side-project) to get some online traction but haven't got much luck.
In fall 2026 I completely overhauled it and tried to make it easy to abstract away the commands from the main application code I chose to use .ini files in which the user can simply add commands. For example, here is a command list for a DMM
[command]
read = MEAS1?
query = *IDN?
get_mode = FUNC1?
get_range = RANGE?
range_auto = AUTO
sample_slow = RATE S
sample_medium = RATE M
sample_fast = RATE F
In practice, it's not as simple as adding commands this way. Each piece of equipment has weird quirks. Most of the quirks I've seen are on the reading side. For example, some power-supplies have reading if the channel is in constant-voltage mode or constant-current mode in a single read. Others lump it into a broader status reading and the user has to parse it out. Most of the simple functions (read DMM voltage, set supply, set range) should be easy enough to get going with your equipment pretty easily though.
Anyway, because EEequipment has pre-defined classes and methods we can simply load in your respective piece of test equipment into the main application.
Here is an example of loading in my Siglent SPD3303X power supply.
ps = SPD3303X()
ps.set_voltage(1, 2.3) # set channel 1 to 2.3 V
ps.output_on(1) # turn channel 1 on
Building Wins
Open-source GitHub projects
I was greatly helped by some code I found on GitHub for the specific test equipment I was aiming to control. This code helped speed up the backend code development. Although my current equipment code has morphed to be pretty far from this open-source code I found, it was a great starting point.
low GUI overhead
I was also helped by already having a basic Tkinter framework down for my Financial-Analyzer project, as that one previously was a GUI using Tkinter before I moved it to be command-line interface only. This example skeleton code (and more importantly some prior experience with elements and how to use them) was useful in getting started.
Some people reading this may be laughing at me using Tkinter (ugly, old, etc) but for a simple test lab application I really don't require anything fancy.
Challenges
The first main challenge (like all projects) was just plain getting started. Getting some basic communication going with all my hardware, getting a framework down for GUI code structure, learning my capabilities and how I was going to implement them.
thread / runtime management
Some of the tasks like logging and reading serial (UART) data require some threading to be happening so the main GUI application can continue. This was my first time writing a threaded application that runs on a regular computer, I have experience with embedded RTOS system threading. It was fairly simple to get the threading module in Python up and running but took some tweaking which is why I'm marking it as a challenge.
I had to get all proper with my serial thread, having it throw samples into a queue and process them as the CPU cycles become available. I haven't noticed much data dropping happening, but I haven't run it through a massive stress test with a high baud-rate and tons of data streaming while I'm clicking happy around the GUI.
I'm sure a more experienced software engineer could take one look at my code and improve my usage of buffers and threading, but for now it works.
decoupling the GUI and application logic
This one is still ongoing. I really have a hard time properly writing code with everything that is GUI related in certain files, and all the application logic in another. I really want this separation to be clean if I ever want to switch from Tkinter, or Python completely as the GUI interface. I'm not sure what I would switch to (maybe pure HTML/CSS/Javascript? Java?) but I'm preparing for if that day comes. It also is just cleaner code, and allows me to reuse the application code in other stuff more easily (for example logging and graphing features)
operating system support
Specifically for this project, one challenge was support for multiple operating systems. I started develoment on my main Windows computer, and made the switch over to a custom Linux PC I built. This was useful because Linux is completely free and (although slightly more complicated), allowed more control over how I wanted everything to interface with the host PC. In practice, this mainly relies on an operating system check and multiple path options
The other challenge was code testing. In order to fully test some features and discover bugs, I had to be fully connected to specific hardware. However, as I mentioned previously in some ways this turned into an advantage. There was multiple vacations where I got a ton of major code work done because I wasn't constantly re-running the program and tweaking things. I had time to do big refactors and improvements offline, and then tweak the final details when I was back at my test setup.
Conclusion
Status and Results
For what I originally set out to manage with this project, I am extremely pleased with the current status. Now that the basic feature set of program flashing, equipment control, and datalogging are in place and very robust I deemed this application good enough to show off to the world.
Overall, the project just works. There are some bugs I encounter once in a while, but the feature set is basic enough and the program features separate enough in the code that debugging is often quite simple. When I finally started adding more test equipment I was surprised at how few hiccups there were, and I truly had created an equipment model agnostic piece of software.
Reflection
This project was super enjoyable to build. The software is pretty polished now, and it indeed has made embedded debugging much more seamless. I don't have to rely on using an IDE to communicate with my debugger. I simply have to open one application to do everything from data management, to controlling my embedded device with HIL testing.
Development flow was slightly stuttered by developing the application in parallel with what I was testing. You're trying to work on firmware development for your device, then something bothers you about the test application so you switch what you're working on, then you try to switch back ..... you get the point. Multi-tasking code writing hard!
Some of the most productive work on this project took place offline in "simulator" mode when I wasn't actually even connected to any test hardware. This way I just solely focused on code improvements and closing TODO items, and then cleaning up any bugs once I was back connected to everything.
Looking forward
I'm still actively working on this project, and likely will be for a while. Fortunately, I enjoy coding as it's a good break from hardware design. I will likely continue to work on the project in the same way that 90% of development has happened - really slowly adding features as I use it more and desire something. Much of my programming happens "on the fly" as I actively use the software. When necessary, I jot down TODOs so I can revisit certain features later without needing to be physically connected to the hardware. Sometimes it distracts me from actually working on the project at hand that I'm using the equipment for, which is a dangerous trap :)
I think also in the future my hardware design will become more and more complex. Right now it is pretty much a glorified connector interface, with banana jack inputs and header pins. In the future, I would like to add more active component such as an FTDI converter for UART to USB conversion or some current-sensing module built in.
I would also like to integrate more closely with my embedded probe testing hardware, possibly adding another piece of equipment that can sample the analog voltages of the probe pins.